Algeria Developer Index · Rankings
Country rankings on GitHub
Compare global account populations, then explore GitHub’s separate GDC26 ranking of activity per working-age person. Each list measures something different.
01 · Measured today
Global standings by developer accounts
Reported economies, ordered by total GitHub accounts. Growth compares with the same quarter a year earlier.
djazair.dev calculates these ranks from account counts. Countries and territories are included; the EU aggregate is excluded to avoid counting its members twice. Ties share a rank. Accounts include inactive ones and are located by network address. This measures community size, not open-source contribution or code quality.
| Country / territory | Position | Developer accounts | Annual growth |
|---|---|---|---|
| United States US | 1 | 32,410,529 | +25.4% |
| India IN | 2 | 26,727,004 | +38.8% |
| China CN | 3 | 11,351,939 | +9.3% |
| Brazil BR | 4 | 8,317,960 | +36.4% |
| United Kingdom GB | 5 | 5,559,767 | +24.5% |
| Japan JP | 6 | 5,433,912 | +36.5% |
| Indonesia ID | 7 | 5,270,032 | +32.4% |
| Germany DE | 8 | 5,255,625 | +31.2% |
| Russia RU | 9 | 4,627,668 | +16.8% |
| France FR | 10 | 4,034,001 | +27.9% |
| Canada CA | 11 | 3,991,305 | +24.3% |
| Hong Kong HK | 12 | 3,485,551 | +36.1% |
| South Korea KR | 13 | 3,145,730 | +29.2% |
| Vietnam VN | 14 | 2,972,715 | +35.2% |
| Mexico MX | 15 | 2,865,151 | +35.1% |
| Philippines PH | 16 | 2,815,527 | +41.3% |
| Spain ES | 17 | 2,802,085 | +32.4% |
| Türkiye TR | 18 | 2,544,065 | +30.2% |
| Pakistan PK | 19 | 2,497,496 | +45.3% |
| Australia AU | 20 | 2,368,357 | +26.6% |
| Netherlands NL | 21 | 2,185,318 | +36.7% |
| Singapore SG | 22 | 2,170,580 | +42.3% |
| Poland PL | 23 | 2,074,728 | +28.9% |
| Italy IT | 24 | 1,989,642 | +31.9% |
| Taiwan TW | 25 | 1,890,259 | +33.3% |
| Bangladesh BD | 26 | 1,882,249 | +34.5% |
| Nigeria NG | 27 | 1,794,519 | +35.8% |
| Ukraine UA | 28 | 1,729,006 | +20.9% |
| Colombia CO | 29 | 1,670,892 | +36.9% |
| Egypt EG | 30 | 1,626,418 | +43.9% |
| Argentina AR | 31 | 1,599,355 | +30.7% |
| Thailand TH | 32 | 1,570,196 | +37.0% |
| Malaysia MY | 33 | 1,139,033 | +32.2% |
| South Africa ZA | 34 | 1,058,997 | +42.8% |
| Sweden SE | 35 | 1,029,024 | +25.0% |
| Saudi Arabia SA | 36 | 988,061 | +47.2% |
| Israel IL | 37 | 935,953 | +29.9% |
| Peru PE | 38 | 907,052 | +39.6% |
| Morocco MA | 39 | 906,406 | +43.2% |
| Iran IR | 40 | 898,557 | +19.8% |
| Chile CL | 41 | 809,093 | +35.1% |
| Romania RO | 42 | 795,527 | +27.7% |
| Switzerland CH | 43 | 781,300 | +30.2% |
| Belgium BE | 44 | 748,934 | +27.0% |
| Portugal PT | 45 | 740,488 | +32.8% |
| Kenya KE | 46 | 678,197 | +46.3% |
| United Arab Emirates AE | 47 | 656,185 | +44.6% |
| Austria AT | 48 | 611,388 | +33.6% |
| Czechia CZ | 49 | 606,127 | +30.9% |
| Algeria DZ | 50 | 586,990 | +49.1% |
| Denmark DK | 51 | 543,334 | +23.6% |
| Sri Lanka LK | 52 | 541,411 | +32.2% |
| Finland FI | 53 | 538,218 | +31.6% |
| Norway NO | 54 | 510,054 | +27.3% |
| Ireland IE | 55 | 487,502 | +24.4% |
| Nepal NP | 56 | 486,967 | +40.8% |
| Hungary HU | 57 | 464,901 | +23.3% |
| Kazakhstan KZ | 58 | 463,403 | +45.5% |
| Iraq IQ | 59 | 454,373 | +63.8% |
| New Zealand NZ | 60 | 441,201 | +23.6% |
| Tunisia TN | 61 | 420,582 | +32.9% |
| Ecuador EC | 62 | 418,829 | +42.1% |
| Belarus BY | 63 | 407,977 | +15.9% |
| Uzbekistan UZ | 64 | 395,040 | +53.3% |
| Greece GR | 65 | 394,067 | +24.6% |
| Bulgaria BG | 66 | 362,099 | +27.7% |
| Venezuela VE | 67 | 345,018 | +40.9% |
| Ghana GH | 68 | 328,387 | +47.1% |
| Serbia RS | 69 | 325,368 | +21.3% |
| Ethiopia ET | 70 | 251,351 | +52.9% |
| Jordan JO | 71 | 242,986 | +49.1% |
| Cambodia KH | 72 | 235,476 | +59.4% |
| Costa Rica CR | 73 | 231,325 | +30.1% |
| Lithuania LT | 74 | 227,028 | +29.5% |
| Bolivia BO | 75 | 222,560 | +43.3% |
| Dominican Republic DO | 76 | 217,451 | +45.2% |
| Slovakia SK | 77 | 212,894 | +28.9% |
| Myanmar (Burma) MM | 78 | 199,199 | +32.6% |
| Georgia GE | 79 | 198,539 | +28.0% |
| Guatemala GT | 80 | 195,658 | +37.2% |
| Azerbaijan AZ | 81 | 195,331 | +43.6% |
| Croatia HR | 82 | 191,502 | +22.3% |
| Latvia LV | 83 | 190,889 | +45.3% |
| Lebanon LB | 84 | 165,282 | +34.4% |
| Uruguay UY | 85 | 160,501 | +29.9% |
| Estonia EE | 86 | 149,001 | +28.8% |
| Uganda UG | 87 | 147,165 | +60.9% |
| Yemen YE | 88 | 146,772 | +70.0% |
| Armenia AM | 89 | 141,176 | +23.3% |
| Moldova MD | 90 | 140,751 | +42.8% |
| Cameroon CM | 91 | 139,140 | +59.0% |
| El Salvador SV | 92 | 136,169 | +37.3% |
| Kyrgyzstan KG | 93 | 121,507 | +40.1% |
| Tanzania TZ | 94 | 121,146 | +58.8% |
| Slovenia SI | 95 | 117,306 | +23.1% |
| Côte d’Ivoire CI | 96 | 112,935 | +56.5% |
| Palestine PS | 97 | 112,567 | +31.7% |
| Kuwait KW | 98 | 112,085 | +38.8% |
| Qatar QA | 99 | 109,057 | +43.2% |
| Albania AL | 100 | 103,489 | +27.6% |
| Honduras HN | 101 | 103,171 | +42.9% |
| Bosnia & Herzegovina BA | 102 | 99,259 | +21.1% |
| Cyprus CY | 103 | 96,793 | +38.5% |
| Panama PA | 104 | 96,375 | +39.3% |
| Oman OM | 105 | 95,170 | +50.5% |
| Paraguay PY | 106 | 93,779 | +45.1% |
| Senegal SN | 107 | 91,364 | +47.7% |
| Mongolia MN | 108 | 89,495 | +40.8% |
| Rwanda RW | 109 | 87,857 | +59.5% |
| Zimbabwe ZW | 110 | 84,670 | +57.4% |
| North Macedonia MK | 111 | 81,773 | +20.3% |
| Angola AO | 112 | 81,314 | +73.0% |
| Madagascar MG | 113 | 81,275 | +56.5% |
| Puerto Rico PR | 114 | 76,405 | +30.0% |
| Libya LY | 115 | 73,665 | +65.0% |
| Somalia SO | 116 | 72,309 | +63.0% |
| Nicaragua NI | 117 | 69,807 | +43.7% |
| Syria SY | 118 | 67,957 | +37.1% |
| Benin BJ | 119 | 66,467 | +56.8% |
| DR Congo CD | 120 | 66,438 | +88.4% |
| Zambia ZM | 121 | 64,531 | +66.1% |
| Bahrain BH | 122 | 62,656 | +38.7% |
| Luxembourg LU | 123 | 61,847 | +25.8% |
| Afghanistan AF | 124 | 59,957 | +56.9% |
| Jamaica JM | 125 | 58,587 | +33.1% |
| Cuba CU | 126 | 52,084 | +17.4% |
| Mauritius MU | 127 | 50,296 | +34.9% |
| Sudan SD | 128 | 49,732 | +44.0% |
| Kosovo XK | 129 | 48,832 | +45.3% |
| Mozambique MZ | 130 | 48,751 | +76.8% |
| Malta MT | 131 | 43,600 | +25.6% |
| Iceland IS | 132 | 42,927 | +20.4% |
| Trinidad & Tobago TT | 133 | 41,845 | +25.9% |
| Laos LA | 134 | 40,818 | +53.0% |
| Macao SAR China MO | 135 | 40,701 | +32.1% |
| Togo TG | 136 | 40,421 | +49.9% |
| Malawi MW | 137 | 35,746 | +62.8% |
| Burkina Faso BF | 138 | 33,834 | +72.0% |
| Botswana BW | 139 | 30,651 | +53.2% |
| Haiti HT | 140 | 29,835 | +58.7% |
| Montenegro ME | 141 | 29,425 | +24.5% |
| Seychelles SC | 142 | 26,777 | +187.6% |
| Tajikistan TJ | 143 | 26,111 | +63.1% |
| Réunion RE | 144 | 24,175 | +32.9% |
| Maldives MV | 145 | 22,798 | +37.0% |
| Namibia NA | 146 | 22,072 | +44.8% |
| Mali ML | 147 | 21,292 | +47.6% |
| Congo CG | 148 | 18,243 | +80.1% |
| Brunei BN | 149 | 17,551 | +19.9% |
| Sierra Leone SL | 150 | 16,670 | +64.0% |
| Papua New Guinea PG | 151 | 16,631 | +62.7% |
| Mauritania MR | 152 | 16,255 | +65.9% |
| Gabon GA | 153 | 16,223 | +57.0% |
| Guinea GN | 154 | 15,644 | +75.0% |
| Bhutan BT | 155 | 14,370 | +36.8% |
| Liberia LR | 156 | 11,954 | +58.5% |
| Bahamas BS | 157 | 11,344 | +26.7% |
| Guyana GY | 158 | 11,193 | +30.2% |
| Fiji FJ | 159 | 10,906 | +42.8% |
| Barbados BB | 160 | 10,660 | +22.7% |
| Lesotho LS | 161 | 10,459 | +55.8% |
| Belize BZ | 162 | 9,715 | +34.7% |
| Burundi BI | 163 | 9,617 | +52.7% |
| Niger NE | 164 | 9,598 | +72.0% |
| Guadeloupe GP | 165 | 9,550 | +41.5% |
| Suriname SR | 166 | 8,887 | +34.7% |
| Gambia GM | 167 | 8,554 | +44.0% |
| Eswatini SZ | 168 | 7,975 | +54.3% |
| Martinique MQ | 169 | 7,814 | +42.9% |
| Turkmenistan TM | 170 | 7,738 | −10.2% |
| Cabo Verde CV | 171 | 7,526 | +29.5% |
| Andorra AD | 172 | 7,489 | +48.5% |
| South Sudan SS | 173 | 7,034 | +90.3% |
| Chad TD | 174 | 6,676 | +110.8% |
| French Polynesia PF | 175 | 6,057 | +34.6% |
| Guam GU | 176 | 6,030 | +18.7% |
| Djibouti DJ | 177 | 5,867 | +58.2% |
| Isle of Man IM | 178 | 5,564 | +20.8% |
| New Caledonia NC | 179 | 5,328 | +24.0% |
| Jersey JE | 180 | 5,168 | +29.7% |
| Curaçao CW | 181 | 5,044 | +31.7% |
| Cayman Islands KY | 182 | 4,464 | +36.9% |
| St. Lucia LC | 183 | 4,283 | +29.7% |
| French Guiana GF | 184 | 3,915 | +30.9% |
| Aruba AW | 185 | 3,848 | +31.2% |
| Timor-Leste TL | 186 | 3,545 | +59.5% |
| Bermuda BM | 187 | 3,257 | +22.5% |
| Monaco MC | 188 | 3,256 | +36.2% |
| Grenada GD | 189 | 3,085 | +26.4% |
| Liechtenstein LI | 190 | 3,056 | +43.9% |
| Gibraltar GI | 191 | 3,007 | +16.6% |
| U.S. Virgin Islands VI | 192 | 2,892 | +27.2% |
| Guernsey GG | 193 | 2,691 | +33.0% |
| Antigua & Barbuda AG | 194 | 2,570 | +31.3% |
| Faroe Islands FO | 195 | 2,508 | +24.0% |
| Equatorial Guinea GQ | 196 | 2,289 | +57.9% |
| St. Vincent & Grenadines VC | 197 | 2,176 | +24.5% |
| Dominica DM | 198 | 1,803 | +32.7% |
| Åland Islands AX | 199 | 1,753 | +21.8% |
| Mayotte YT | 200 | 1,746 | +45.1% |
| St. Kitts & Nevis KN | 201 | 1,741 | +46.1% |
| Greenland GL | 202 | 1,682 | +19.8% |
| Eritrea ER | 203 | 1,628 | −2.9% |
| Solomon Islands SB | 204 | 1,533 | +71.5% |
| Guinea-Bissau GW | 205 | 1,521 | +84.4% |
| San Marino SM | 206 | 1,381 | +35.5% |
| Northern Mariana Islands MP | 207 | 1,371 | +23.7% |
| Sint Maarten SX | 208 | 1,299 | +36.7% |
| Vanuatu VU | 209 | 1,289 | +23.2% |
| Turks & Caicos Islands TC | 210 | 1,286 | +45.8% |
| British Virgin Islands VG | 211 | 1,216 | +45.8% |
| Comoros KM | 212 | 1,194 | +73.5% |
| Samoa WS | 213 | 979 | +48.6% |
| Central African Republic CF | 214 | 868 | +65.6% |
| São Tomé and Príncipe ST | 215 | 859 | +73.5% |
| American Samoa AS | 216 | 830 | +31.7% |
| Tonga TO | 217 | 778 | +54.4% |
| Caribbean Netherlands BQ | 218 | 770 | +34.6% |
| Anguilla AI | 219 | 634 | +15.7% |
| Micronesia FM | 220 | 570 | +49.2% |
| Kiribati KI | 221 | 520 | +175.1% |
| Palau PW | 222 | 397 | +24.8% |
| St. Martin MF | 223 | 375 | +19.0% |
| Marshall Islands MH | 224 | 340 | +39.3% |
| Cook Islands CK | 225 | 307 | +32.3% |
| St. Pierre & Miquelon PM | 226 | 225 | +17.8% |
| Vatican City VA | 227 | 180 | +9.1% |
| Montserrat MS | 228 | 124 | — |
| Nauru NR | 229 | 110 | — |
Source: GitHub Innovation Graph · Q1 2026. Download country standings (CSV)
GDC26 ranking
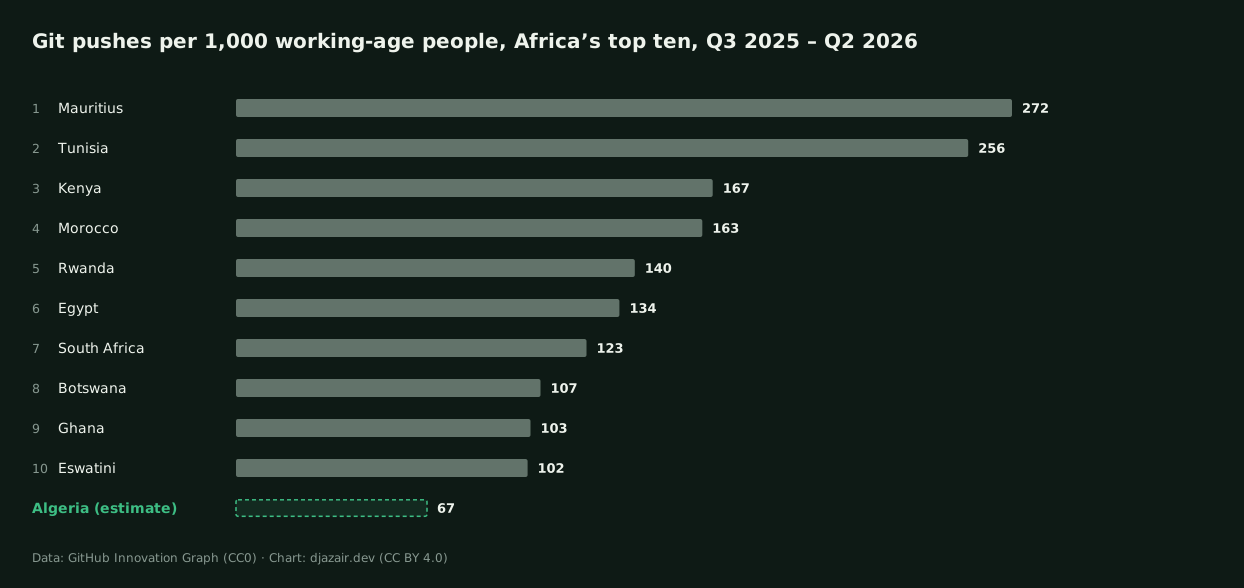
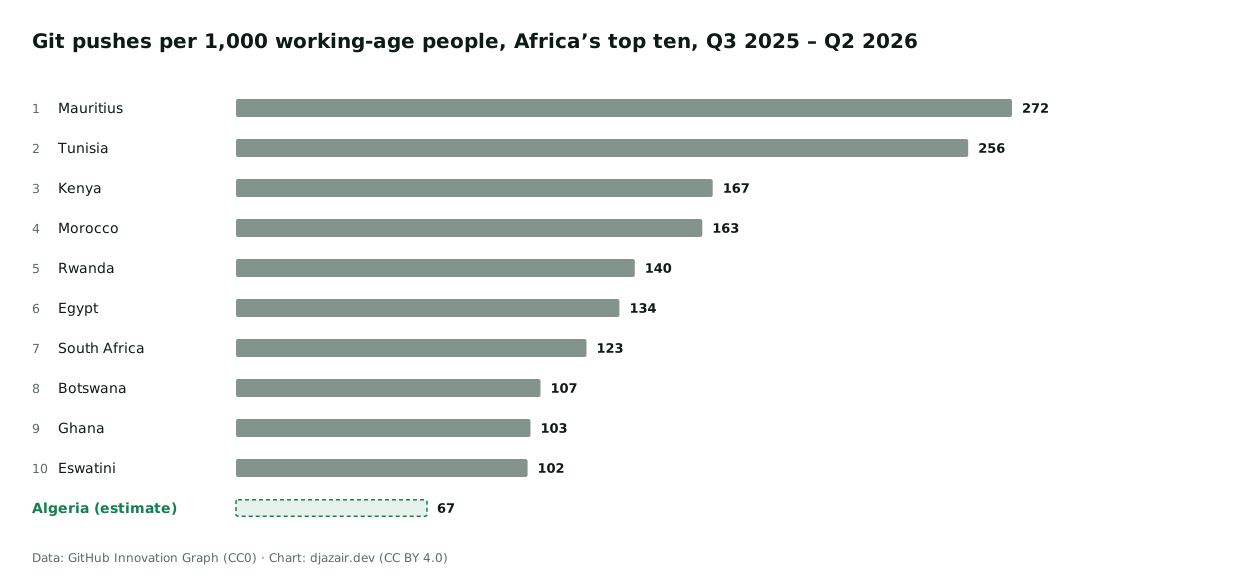
For the Global Digital Collaboration Conference in Geneva, 1–3 September 2026, GitHub ranked economies by git pushes per 1,000 working-age people, corrected for VPN use. It is a one-off dataset, outside the quarterly Index. Algeria isn’t in Africa’s top ten, so its figure here is djazair.dev’s estimate.
Mauritius leads Africa with 272 pushes per 1,000 working-age people, ahead of Tunisia (256) and Kenya (167). From North Africa, the top ten has Tunisia (2nd), Morocco (4th) and Egypt (6th). GitHub doesn’t list Algeria. By djazair.dev’s estimate it stands at about 67, against 102 for Eswatini in tenth place.
GitHub’s other GDC26 list ranks the 30 economies with the most pushes. From Africa it has Nigeria (25th) and Egypt (28th).
Source: GitHub, GDC26 supplementary data (CC0), published 31 August 2026. Algeria: djazair.dev’s estimate from the GitHub Innovation Graph and the World Bank.
Data table
| Economy | Pushes per 1,000 working-age people |
|---|---|
| Mauritius | 272 |
| Tunisia | 256 |
| Kenya | 167 |
| Morocco | 163 |
| Rwanda | 140 |
| Egypt | 134 |
| South Africa | 123 |
| Botswana | 107 |
| Ghana | 103 |
| Eswatini | 102 |
| Algeria (estimate) | 67 |
Every value the chart draws. The same figures are in the CSV.
Algeria’s estimate
How djazair.dev gets about 67
GitHub’s correction for VPN use rests on the locations in developers’ profiles, which aren’t public. djazair.dev applies the rest of GitHub’s method to the quarterly files: the same four quarters of pushes, divided by the same working-age population. Quarters not released yet are taken as equal to Q1 2026: Q2 2026.
| Step | Value |
|---|---|
| Git pushes, Q3 2025 | 306,426 |
| Git pushes, Q4 2025 | 452,950 |
| Git pushes, Q1 2026 | 623,978 |
| Git pushes, Q2 2026 (taken as Q1 2026) | 623,978 |
| Pushes over the four quarters | 2,007,332 |
| People aged 15 to 64, 2025 (World Bank) | 30,011,643 |
| Per 1,000 working-age people | 66.9 |
Tenth place, Eswatini at 102, would take about 1.5 times Algeria’s estimated pushes: some 3.07 million over the four quarters instead of 2.01 million.
Checked against GitHub
The same estimate for the ten GitHub lists
Applied to the ten economies GitHub lists, the estimate comes within 13% of GitHub’s figure for 9 of them. For Eswatini, GitHub’s figure is 2.5 times the estimate. Core peers GitHub doesn’t list, by the same estimate: Nigeria (79).
| Economy | GitHub’s rank | GitHub’s figure | Estimate | GitHub ÷ estimate |
|---|---|---|---|---|
| Mauritius | 1 | 272 | 307 | 0.88 |
| Tunisia | 2 | 256 | 249 | 1.03 |
| Kenya | 3 | 167 | 164 | 1.02 |
| Morocco | 4 | 163 | 166 | 0.98 |
| Rwanda | 5 | 140 | 137 | 1.02 |
| Egypt | 6 | 134 | 125 | 1.07 |
| South Africa | 7 | 123 | 113 | 1.09 |
| Botswana | 8 | 107 | 95 | 1.12 |
| Ghana | 9 | 103 | 98 | 1.06 |
| Eswatini | 10 | 102 | 41 | 2.50 |
| Nigeria | — | — | 79 | — |
| Algeria | — | — | 67 | — |
Before you quote them
Read these numbers well
A one-off list
GitHub prepared these lists once, for GDC26. They aren’t part of the quarterly Index and won’t change when new data comes out.
Corrected for VPN use
GitHub moved pushes between economies by comparing the locations in developers’ profiles with where their network addresses place them. Nobody outside GitHub can repeat the correction.
An estimate, not a rank
Algeria’s figure here uses network addresses only, and repeats the latest quarter for any not released yet. It shows roughly where Algeria stands, not a place GitHub gave it.
Per working-age person
The lists divide by people aged 15 to 64, not by all people or by developers. GitHub left out economies under 200,000 people.