Algeria Developer Index · Collaboration
Collaboration across borders, Q1 2026
GitHub counts the git pushes and pull requests that developers in one economy send to repositories owned in another. Here: where those from developers in Algeria went, and where those to repositories owned in Algeria came from.
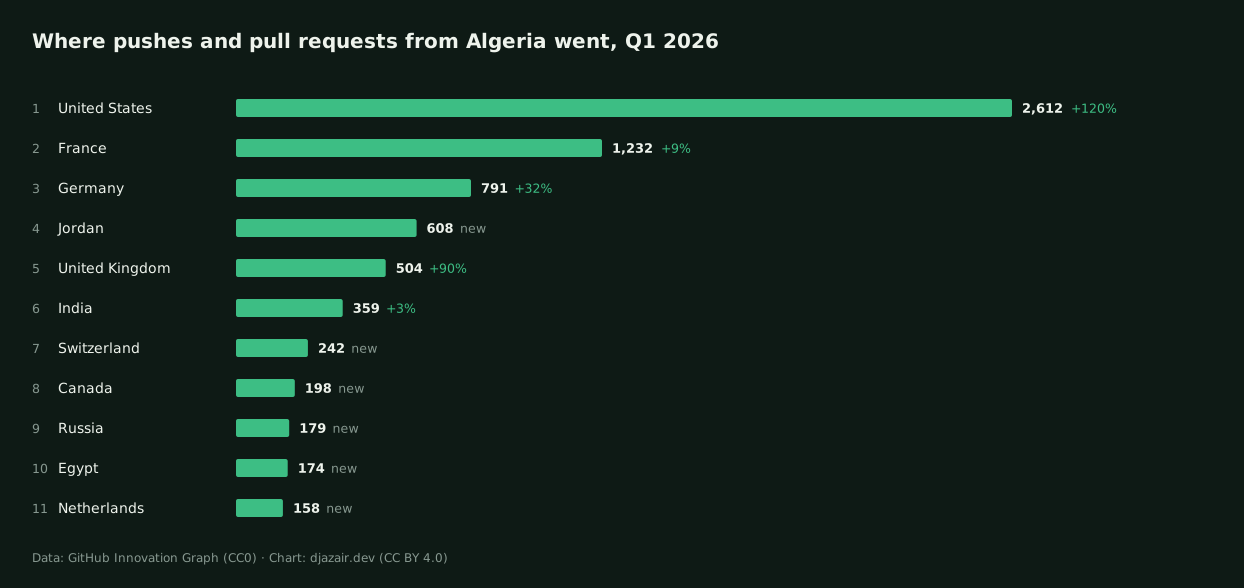
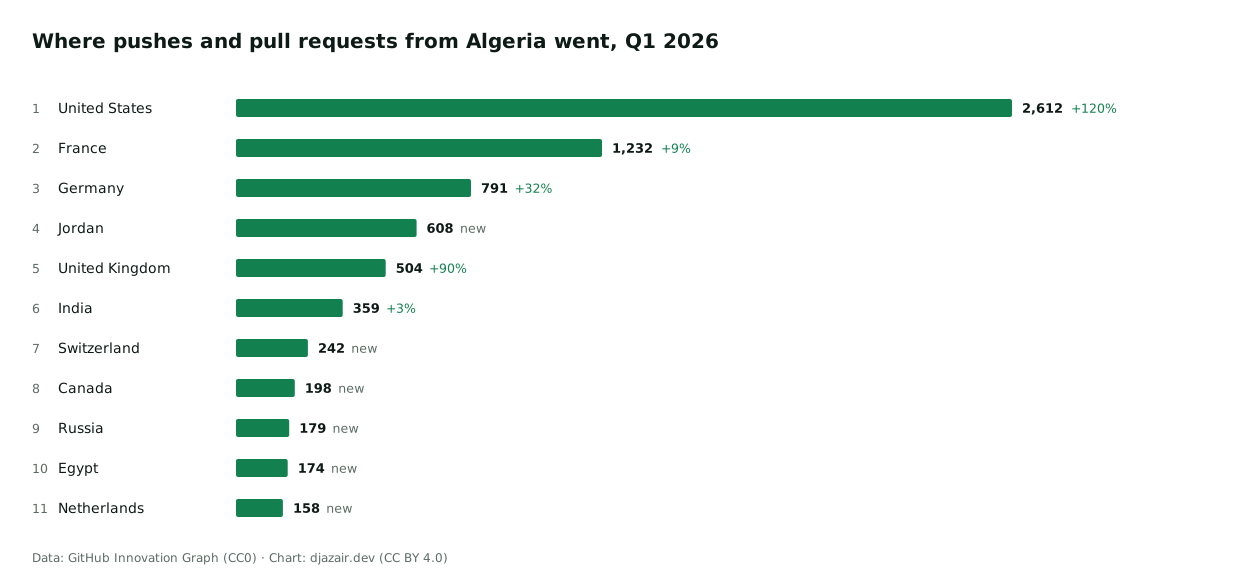
In Q1 2026, repositories owned in the United States received the most pushes and pull requests from developers in Algeria: 2,612, up from 1,188 a year earlier. Next came France, with 1,232, and Germany, with 791.
GitHub also lists the European Union, at 2,181: the sum of France, Germany and the Netherlands above. The bars leave it out so those members don’t count twice.
Source: GitHub Innovation Graph (CC0), Q1 2026 and a year earlier. The economies GitHub lists above its threshold; new: not listed a year earlier.
Data table
| Economy | Q1 2026 | Q1 2025 | Change |
|---|---|---|---|
| United States | 2,612 | 1,188 | +120% |
| France | 1,232 | 1,132 | +9% |
| Germany | 791 | 598 | +32% |
| Jordan | 608 | — | new |
| United Kingdom | 504 | 265 | +90% |
| India | 359 | 347 | +3% |
| Switzerland | 242 | — | new |
| Canada | 198 | — | new |
| Russia | 179 | — | new |
| Egypt | 174 | — | new |
| Netherlands | 158 | — | new |
Every value the chart draws. The same figures are in the CSV.
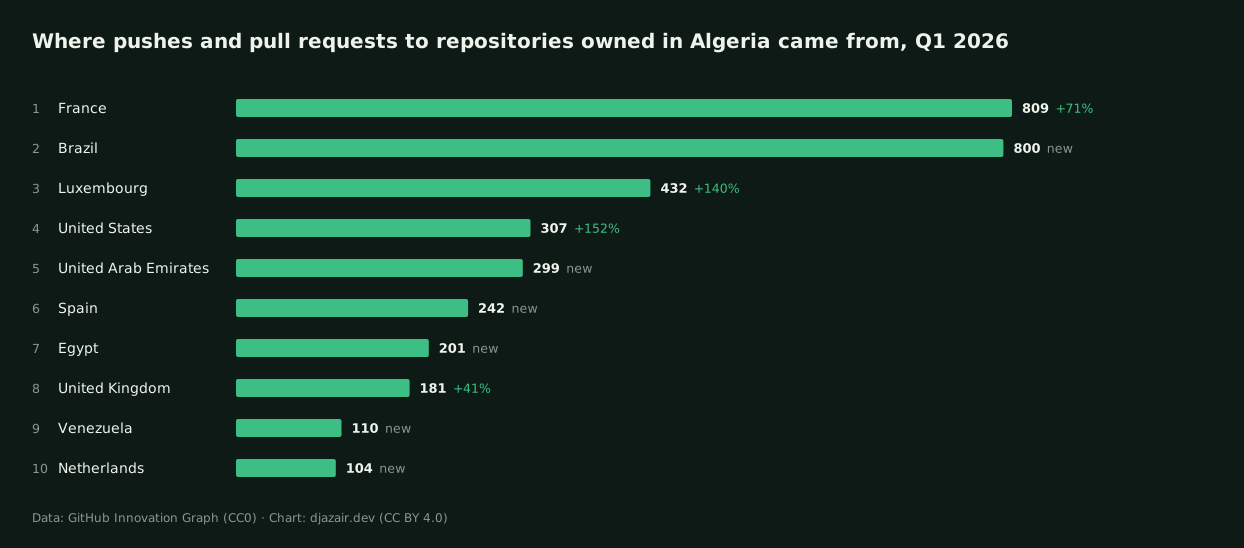
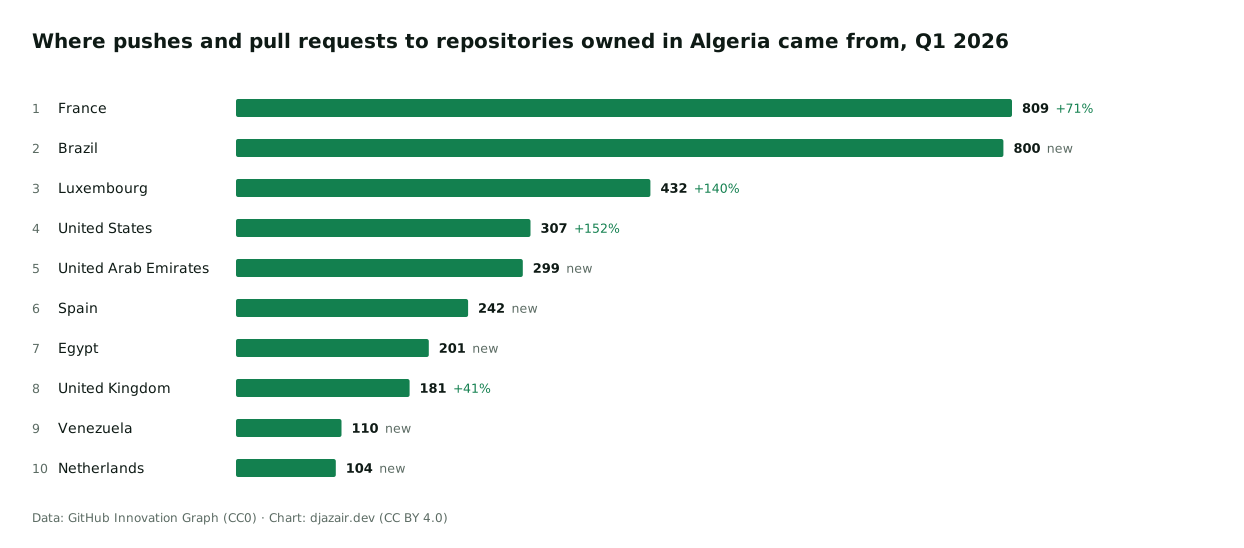
Repositories owned in Algeria received 3,485 pushes and pull requests from the economies listed, against 1,312 a year earlier. The most came from France: 809.
GitHub also lists the European Union, at 1,587: the sum of France, Luxembourg, Spain and the Netherlands above. The bars leave it out so those members don’t count twice.
Source: GitHub Innovation Graph (CC0), Q1 2026 and a year earlier. The economies GitHub lists above its threshold; new: not listed a year earlier.
Data table
| Economy | Q1 2026 | Q1 2025 | Change |
|---|---|---|---|
| France | 809 | 472 | +71% |
| Brazil | 800 | — | new |
| Luxembourg | 432 | 180 | +140% |
| United States | 307 | 122 | +152% |
| United Arab Emirates | 299 | — | new |
| Spain | 242 | — | new |
| Egypt | 201 | — | new |
| United Kingdom | 181 | 128 | +41% |
| Venezuela | 110 | — | new |
| Netherlands | 104 | — | new |
Every value the chart draws. The same figures are in the CSV.
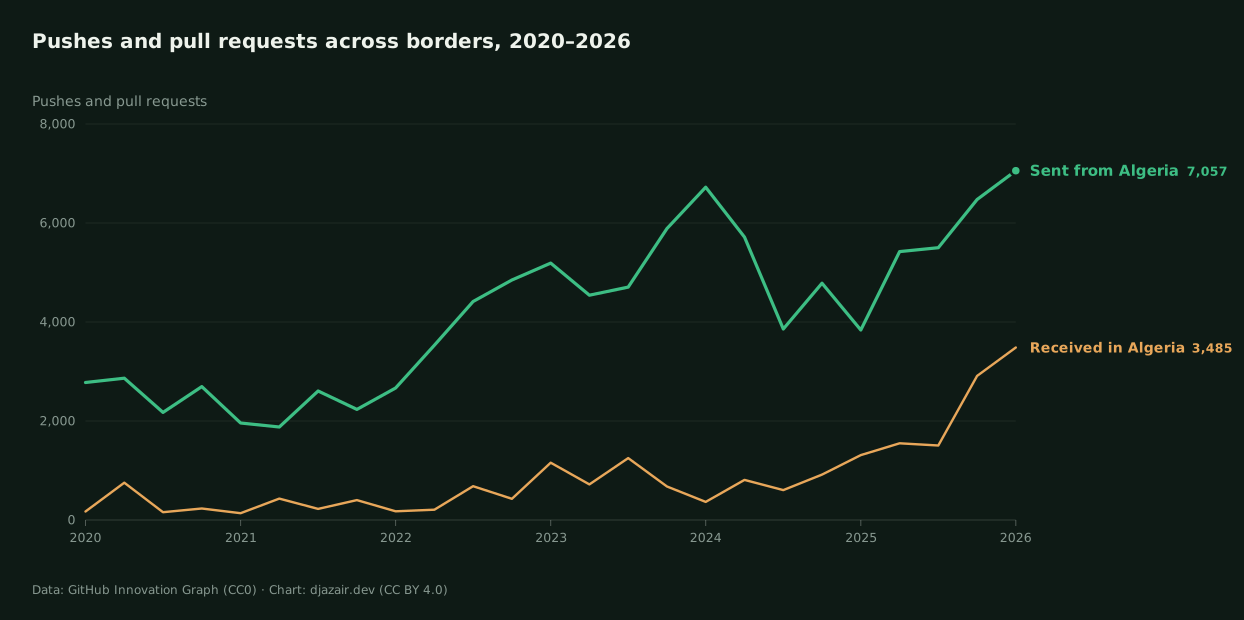
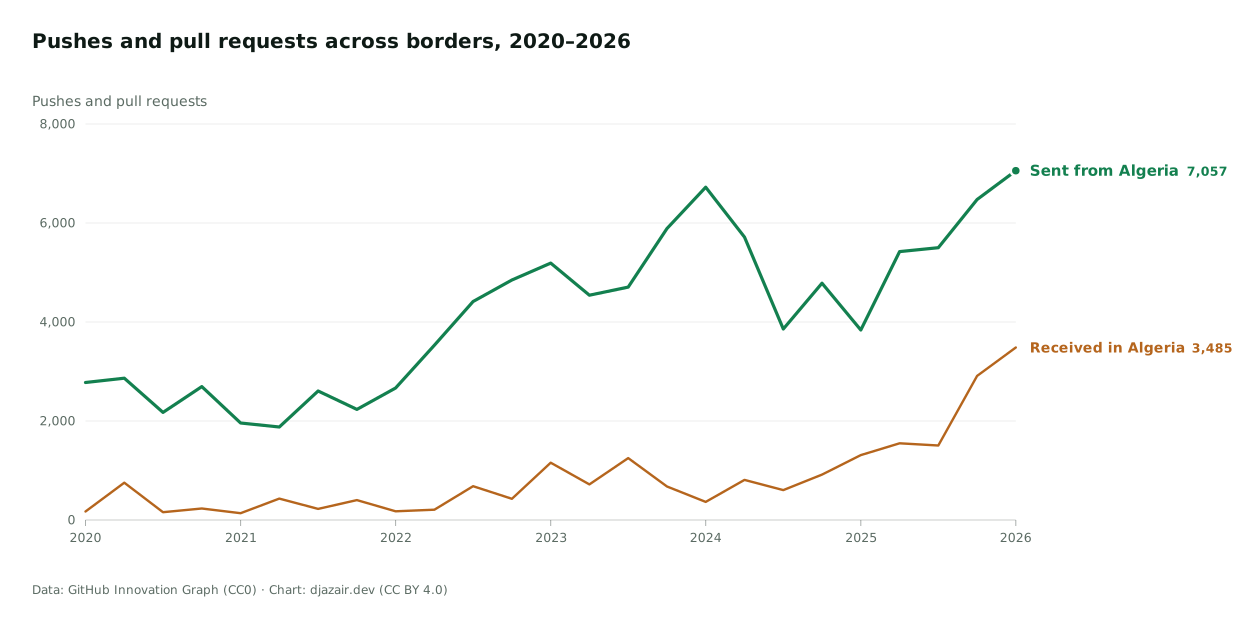
In Q1 2020, developers in Algeria sent 2,777 pushes and pull requests to repositories owned in the economies listed, and repositories owned in Algeria received 172. In Q1 2026: 7,057 sent and 3,485 received.
- Sent from Algeria
- Received in Algeria
Source: GitHub Innovation Graph (CC0), Q1 2020 to Q1 2026. Sums over the economies GitHub lists each quarter, without the European Union.
Data table
| Quarter | Sent from Algeria | Received in Algeria |
|---|---|---|
| 2026 Q1 | 7,057 | 3,485 |
| 2025 Q4 | 6,474 | 2,911 |
| 2025 Q3 | 5,502 | 1,505 |
| 2025 Q2 | 5,422 | 1,550 |
| 2025 Q1 | 3,838 | 1,312 |
| 2024 Q4 | 4,783 | 918 |
| 2024 Q3 | 3,858 | 604 |
| 2024 Q2 | 5,716 | 811 |
| 2024 Q1 | 6,724 | 365 |
| 2023 Q4 | 5,889 | 677 |
| 2023 Q3 | 4,706 | 1,250 |
| 2023 Q2 | 4,542 | 719 |
| 2023 Q1 | 5,189 | 1,158 |
| 2022 Q4 | 4,848 | 428 |
| 2022 Q3 | 4,415 | 683 |
| 2022 Q2 | 3,532 | 209 |
| 2022 Q1 | 2,666 | 175 |
| 2021 Q4 | 2,234 | 402 |
| 2021 Q3 | 2,606 | 225 |
| 2021 Q2 | 1,878 | 433 |
| 2021 Q1 | 1,960 | 137 |
| 2020 Q4 | 2,695 | 233 |
| 2020 Q3 | 2,173 | 157 |
| 2020 Q2 | 2,864 | 754 |
| 2020 Q1 | 2,777 | 172 |
Every value the chart draws. The same figures are in the CSV.
Both ways
Each economy, sent and received
Every economy GitHub lists with Algeria in Q1 2026, in either direction. A dash means GitHub didn’t list the pair that way: it was below the threshold.
| Economy | Sent from Algeria | Received in Algeria |
|---|---|---|
| United States | 2,612 | 307 |
| France | 1,232 | 809 |
| Germany | 791 | — |
| Jordan | 608 | — |
| United Kingdom | 504 | 181 |
| India | 359 | — |
| Switzerland | 242 | — |
| Canada | 198 | — |
| Russia | 179 | — |
| Egypt | 174 | 201 |
| Netherlands | 158 | 104 |
| Brazil | — | 800 |
| Luxembourg | — | 432 |
| United Arab Emirates | — | 299 |
| Spain | — | 242 |
| Venezuela | — | 110 |
| All listed economies | 7,057 | 3,485 |
Before you quote them
Read these numbers well
Placed by the repository’s owner
A repository counts in its owner’s economy, and an organisation’s repositories where most of its members are. A project with contributors in many economies counts toward one, so GitHub calls this a lower bound.
Small pairs aren’t listed
GitHub lists a pair of economies only above its publication threshold. Smaller partners are missing, and an economy can appear one quarter and not the next.
The European Union
GitHub lists the EU as one economy as well. Its figure is the sum of the members listed, so this page leaves it out of rankings and totals. The downloads keep it.
Located by network address
Developers are placed by their network address. A VPN moves a developer’s work to another economy, which can add or hide partners.